Data Visualization - Medicare Enrollment Impact on Community Design
Background and Importance
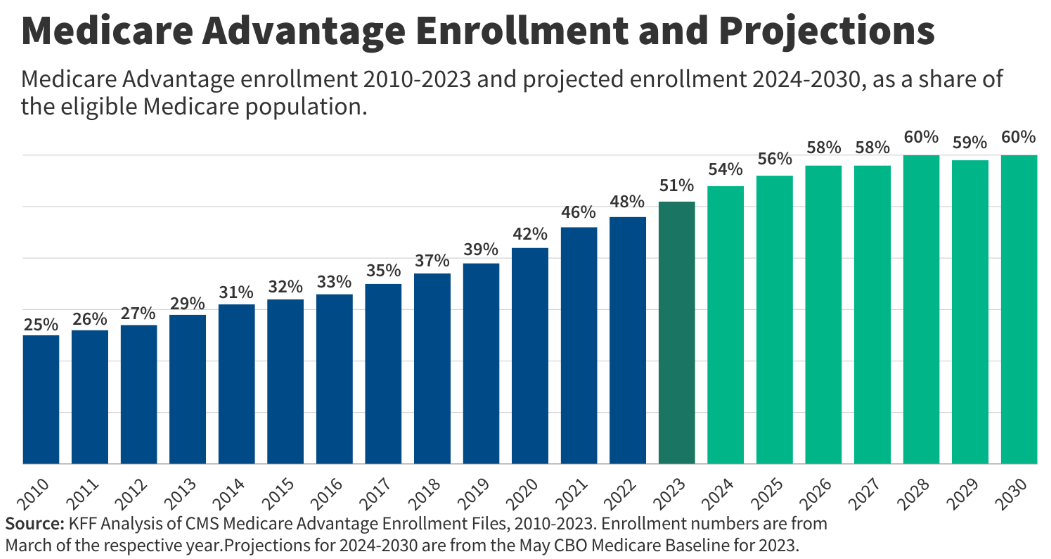
Medicare is a topic that is brought up often in the arena of politics for an array of reasons, ranging from it’s relevancy in modern times to discussions of costs to the American people. These reasons are also coupled with the fact that as life expectancy increases, there will continue to be more and more people enrolled in Medicare. Below is a chart from KFF, and independent group that researches health policies in the US.
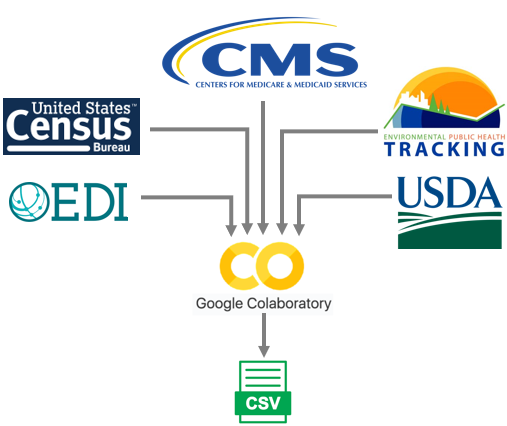
Throughout this analysis, Medicare enrollment will be looked at in comparison to other recorded metrics that may or may not have a direct influence with one another. The intent is to determine what downstream impact Medicare has on non-financial activities that are happening in the same areas.
Questions to be analyzed
Data
Question 1 - In areas that have a larger count of pharmacies, is there also an increased amount of the population that is on Medicare?
This question hopes to find a pattern in the data where areas that have more pharmacies relate to a higher increase in the population that is enrolled in Medicare. Since the two columns in the data are quantitative, a scatterplot is created to plot the counties based on the Medicare enrollment rate and the number of pharmacies. An additional feature that was also encoded into the visual was whether the County is determined to be a Metropolitan by the Department of Agriculture. This was done to see there was any difference in Counties that have more Cities and if so, how much of a difference existed. The final piece of information that was encoded into the visual was creating a simple linear regression of the data, to try to give a quantitative value to any impact the Medicare enrollment rates had on the number of Pharmacies that are located in that County.
Credit: Semester Project by broderickaj
From the visual, the results actually differed from the initial hypothesis that there would be a positive relationship between the two metrics. Starting with the Metro Counties, there existed a large number of outliers in the data, from the analysis and visual there exists a negative relationship where Counties with a higher percentage of the population enrolled in Medicare have a lower count of Pharmacies. What was interesting was that for the Nonmetro Counties, there was no relationship at all which can be seen from the Nonmetro R2 being close to zero.
Question 2 - Do areas with higher concentrations of Medicare enrollees also have a higher percentage of residential energy consumption?
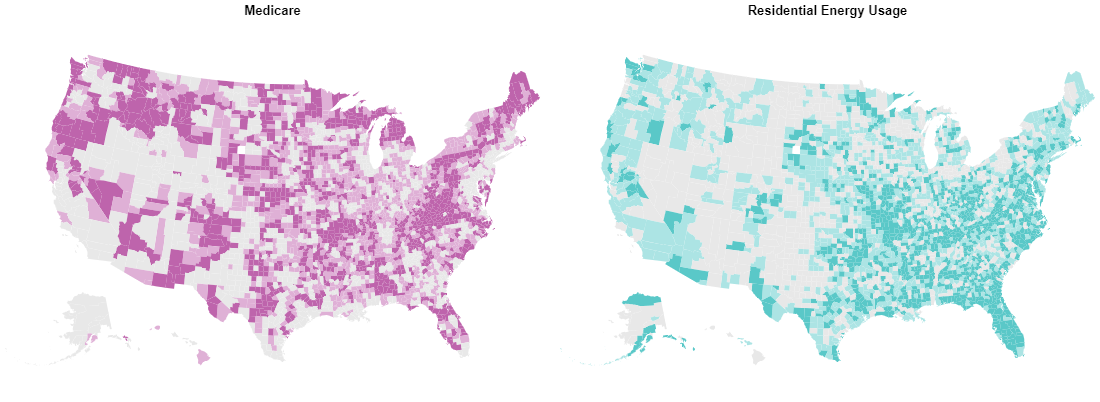
Similar to the first question, this question is looking to see what impact the Medicare enrollment rate might have on an industry in that same County. For this question, the industry is not associated with the medical industry, and that is the energy industry. When it comes to energy, the metrics that was used was creating a percentage of energy that was going to residential buildings, as opposed to industrial or commercial buildings. To avoid creating a similar visual as the first question a bivariate choropleth map was created to see if there were pockets across the US that have combinations of high/low Medicare enrollment and residential energy usage.
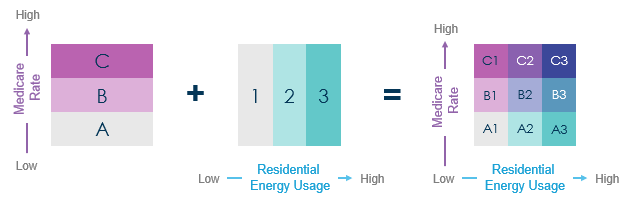
Bivariate choropleth - What is it?To create a bivariate choropleth each of the two metrics will have it's own three-stepped color scale created utilizing the data and then mapped. From there the maps will be overlayed with each another to create the final color scale that now has nine colors. In this analysis the three classification bins were created using the 33rd and 66th quartiles.
Credit: Semester Project by broderickaj
Whilst there are not truly unique patterns in the visual that answer the question, it does help guide the user to areas that might be of interest. From the visual, there are a couple areas on the map that stand out when looking for the dark blue that emphasize a high concentration of Medicare enrollees and a high residential energy usage rate. Some of these areas include:
- Shenandoah Valley/Blue Ridge Mountains
- Areas of Florida
- Interior Highlands
Areas that also sticks out in the visual for the opposite reason is in Nevada and the surrounding States, where there is low percentages for both metrics. In this area of the US, it is sparsely populated from the desert terrain leading to lower results for the information that was analyzed.
An additional layer of interactivity was also created by including a second version of the chart with a drop-down selection feature. This allows for a more detailed look and analysis for a single State.
Credit: Semester Project by broderickaj
Conclusion
Throughout the analysis, there were times where the data hinted at impacts of Medicare Enrollment on the other metrics that it was compared to, but it begs the question "Causation versus Correlation?". There existed a relationship between the metrics, but there definitely no concrete proof that Medicare Enrollment caused the changes in the Number of Pharmacies or the Residential Energy usage. However it did provide some insights when making decisions about the metrics analyzed. For example, if a company was trying to sell a product to a Pharmacy in a selected area of the US, it might be worth looking at the Medicare Enrollment and the saturation of the number of Pharmacies in that area. Non-metro Counties might be at a higher risk and need the product given the low number of Pharmacies and the number of patients that they may serve.
Analysis RetrospectiveWhilst there were some interesting outputs that came from the analysis, there is always room for improvement. These improvements could come in different shapes, but would ultimately improve on the insights which would result in actions. Some of these changes/enhancements would include:
- Scaling on scatterplot - A change to a logarithmic scale could assist in seeing the trends in the relationship between the Medicare Enrollment and the number of Pharmacies.
- Normalizing Pharmacy Count - By creating a rate (such as Pharmacies per 1000 people), it would better highlight potential areas of risk with undersaturation of Pharmacies
- Choropleth Metrics Selection - The addition of a drop-down with other metrics to select would increase the interactivity and insights a user would be able to pull from one visual. Whilst it would require more work on the backend, it would be beneficial to the end user